
Node Exporter is an ‘official’ exporter that collects technical information from Linux nodes, such as CPU, Disk, Memory statistics. It is a base brick on most of prometheus-based monitoring setup.
This week, we celebrate the 1.0.0 release of that exporter. In the past years, the exporter has evolved and there have been some changes, e.g. around metric names and command-line flags. The 1.0.0 release means that those points are considered more stable now.
That release also includes a huge list of changes, new features and bug fixes.
This blog post focuses on two features: the introduction of TLS and Basic Authentication.
About the Prometheus Security Model
The Prometheus Security Model is the place to look at when it comes to Prometheus and security.
That document has been updated lately to meet the recent changes in the Node Exporter. These changes should be available in most of the other binaries in the coming months.
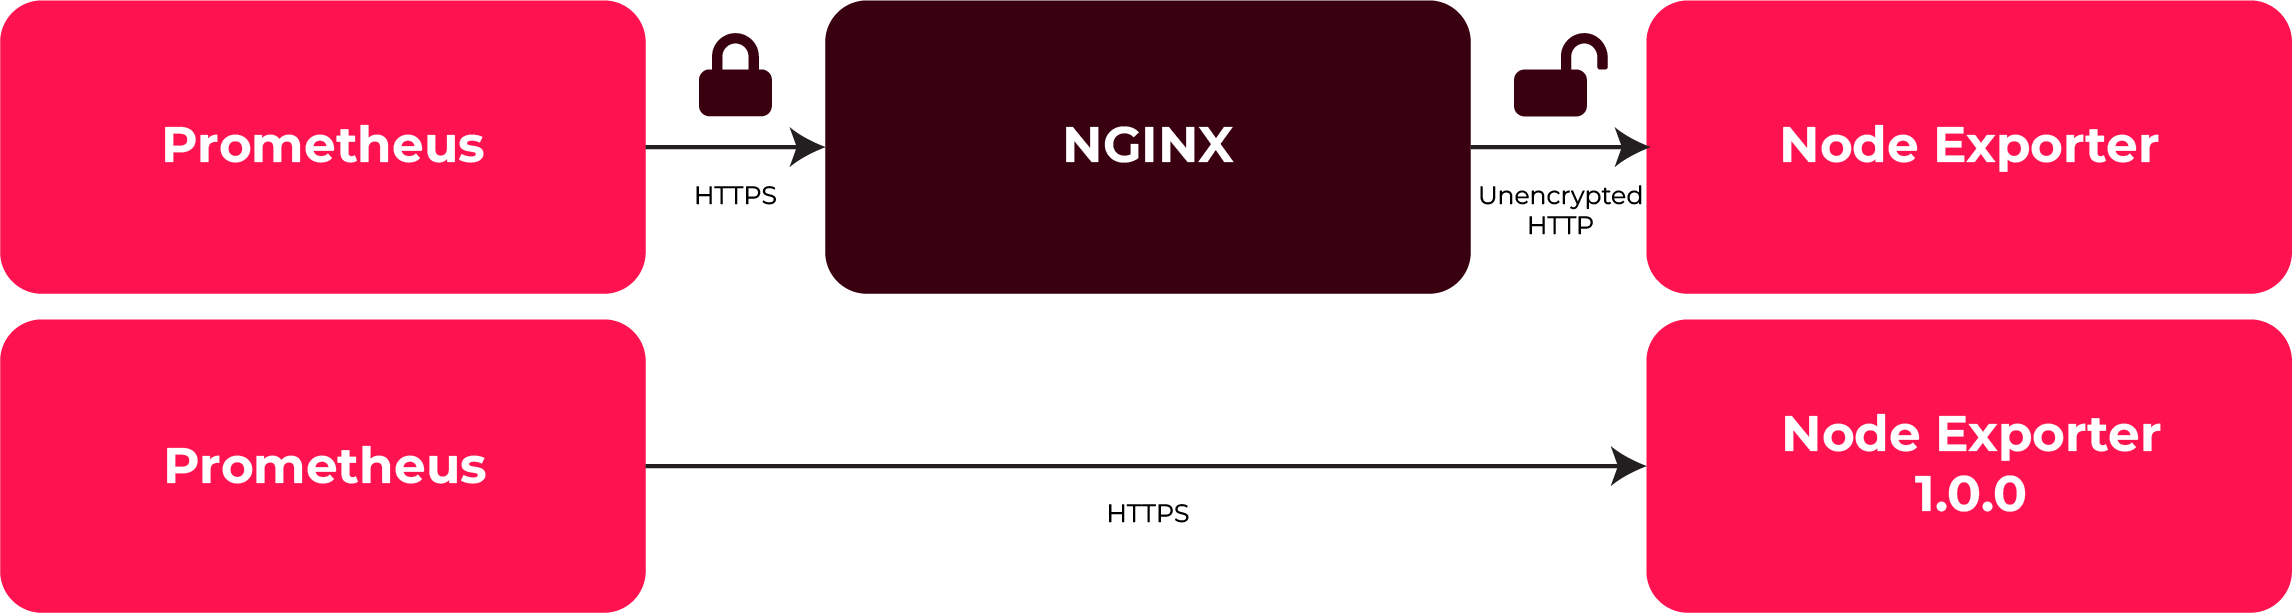
Due to the fact that Metrics are not considered as secrets in Prometheus, for a long time, the way to scrape metrics over HTTPS was to use reverse proxies. Prometheus itself is well instrumented as a client but the exporters did not support TLS directly.
In the coming future (and from now on for the Node Exporter), Prometheus projects will support TLS and Basic Authentication out of the box. The Security Model page also highlights the default security baseline; in short, the default will be to offer TLS version 1.2 and higher.
You are free to tune the TLS configuration if you want to, however, the defaults should just work fine and be secure
How to - TLS
Let’s see how that works in practice. This how-to will demonstrate the setup on a Linux box of a Node Exporter setup, scraped securely by a Prometheus server.
Setup a working directory
In this setup, we will work on a dedicated directory:
$ mkdir ~/node_exporter_tls_example
$ cd ~/node_exporter_tls_example
Note: the Node Exporter or Prometheus should not run as root. They are designed to run as normal users.
Generating TLS certificates
The first step is to generate a self-signed TLS certificate that will be used later on.
$ cd ~/node_exporter_tls_example
$ openssl req -new -newkey rsa:2048 -days 365 -nodes -x509 -keyout node_exporter.key -out node_exporter.crt -subj "/C=BE/ST=Antwerp/L=Brasschaat/O=Inuits/CN=localhost" -addext "subjectAltName = DNS:localhost"
In this command line, localhost is the hostname of the Node Exporter.
Two files are created: node_exporter.crt and node_exporter.key.
Node Exporter configuration
Download Node Exporter v1.0.0, extract it, and copy the previously create certificates:
$ wget https://github.com/prometheus/node_exporter/releases/download/v1.0.0/node_exporter-1.0.0.linux-amd64.tar.gz
$ tar xvf node_exporter-1.0.0.linux-amd64.tar.gz
$ cd node_exporter-1.0.0.linux-amd64
$ mv ../node_exporter.key .
$ cp ../node_exporter.crt .
Note: The key file is moved but the certificate is only copied, as it will be used within the Prometheus server configuration.
Then, create a web.yml file with the TLS configuration:
tls_server_config:
  cert_file: node_exporter.crt
  key_file: node_exporter.key
Start the Node Exporter, using the --web.config command line option:
$ ./node_exporter --web.config=web.yml
[...]
level=info ts=2020-05-24T13:19:37.112Z caller=tls_config.go:200 msg="TLS is
enabled and it cannot be disabled on the fly." http2=true
If you see that message, it means that the Node Exporter is started with TLS support.
Note: All the TLS parameter can be changed on the fly. The Node Exporter reads that file upon each request to generate its TLS settings. It also means that you can renew your certificates on disk and they will be reloaded automatically. All the TLS options are documented in the exporter-toolkit github repository package in Github.
Manual check of the TLS configuration
Check with curl that the TLS configuration is fine. In a new
terminal, run some commands to test it:
$ cd ~/node_exporter_tls_example
$ curl localhost:9100/metrics
Client sent an HTTP request to an HTTPS server.
$ curl --cacert node_exporter.crt https://localhost:9100/metrics
[...]
Instead of --cacert node_exporter.crt you can pass -k to skip curl
certificate validation.
Prometheus configuration
Configure Prometheus to get the metrics over HTTPS. First, download the latest release of Prometheus, extract it, and copy the certificate in its directory:
$ cd ~/node_exporter_tls_example
$ wget https://github.com/prometheus/prometheus/releases/download/v2.18.1/prometheus-2.18.1.linux-amd64.tar.gz
$ tar xvf prometheus-2.18.1.linux-amd64.tar.gz
$ cp node_exporter.crt prometheus-2.18.1.linux-amd64
$ cd prometheus-2.18.1.linux-amd64
Then, adapt the prometheus.yml file with a ’node’ job:
global:
  scrape_interval:     15s
  evaluation_interval: 15s
scrape_configs:
  - job_name: 'prometheus'
    static_configs:
    - targets: ['localhost:9090']
  - job_name: 'node'
    scheme: https
    tls_config:
      ca_file: node_exporter.crt
    static_configs:
    - targets: ['localhost:9100']
You need to set both the tls_config part of the configuration and
the scheme to https. You can see the full tls_config options in the
Prometheus configuration.
And then, start Prometheus:
$ ./prometheus
If visit locally http://localhost:9090/targets with your
browser, you should see https://localhost:9100/metrics in the list of
targets.
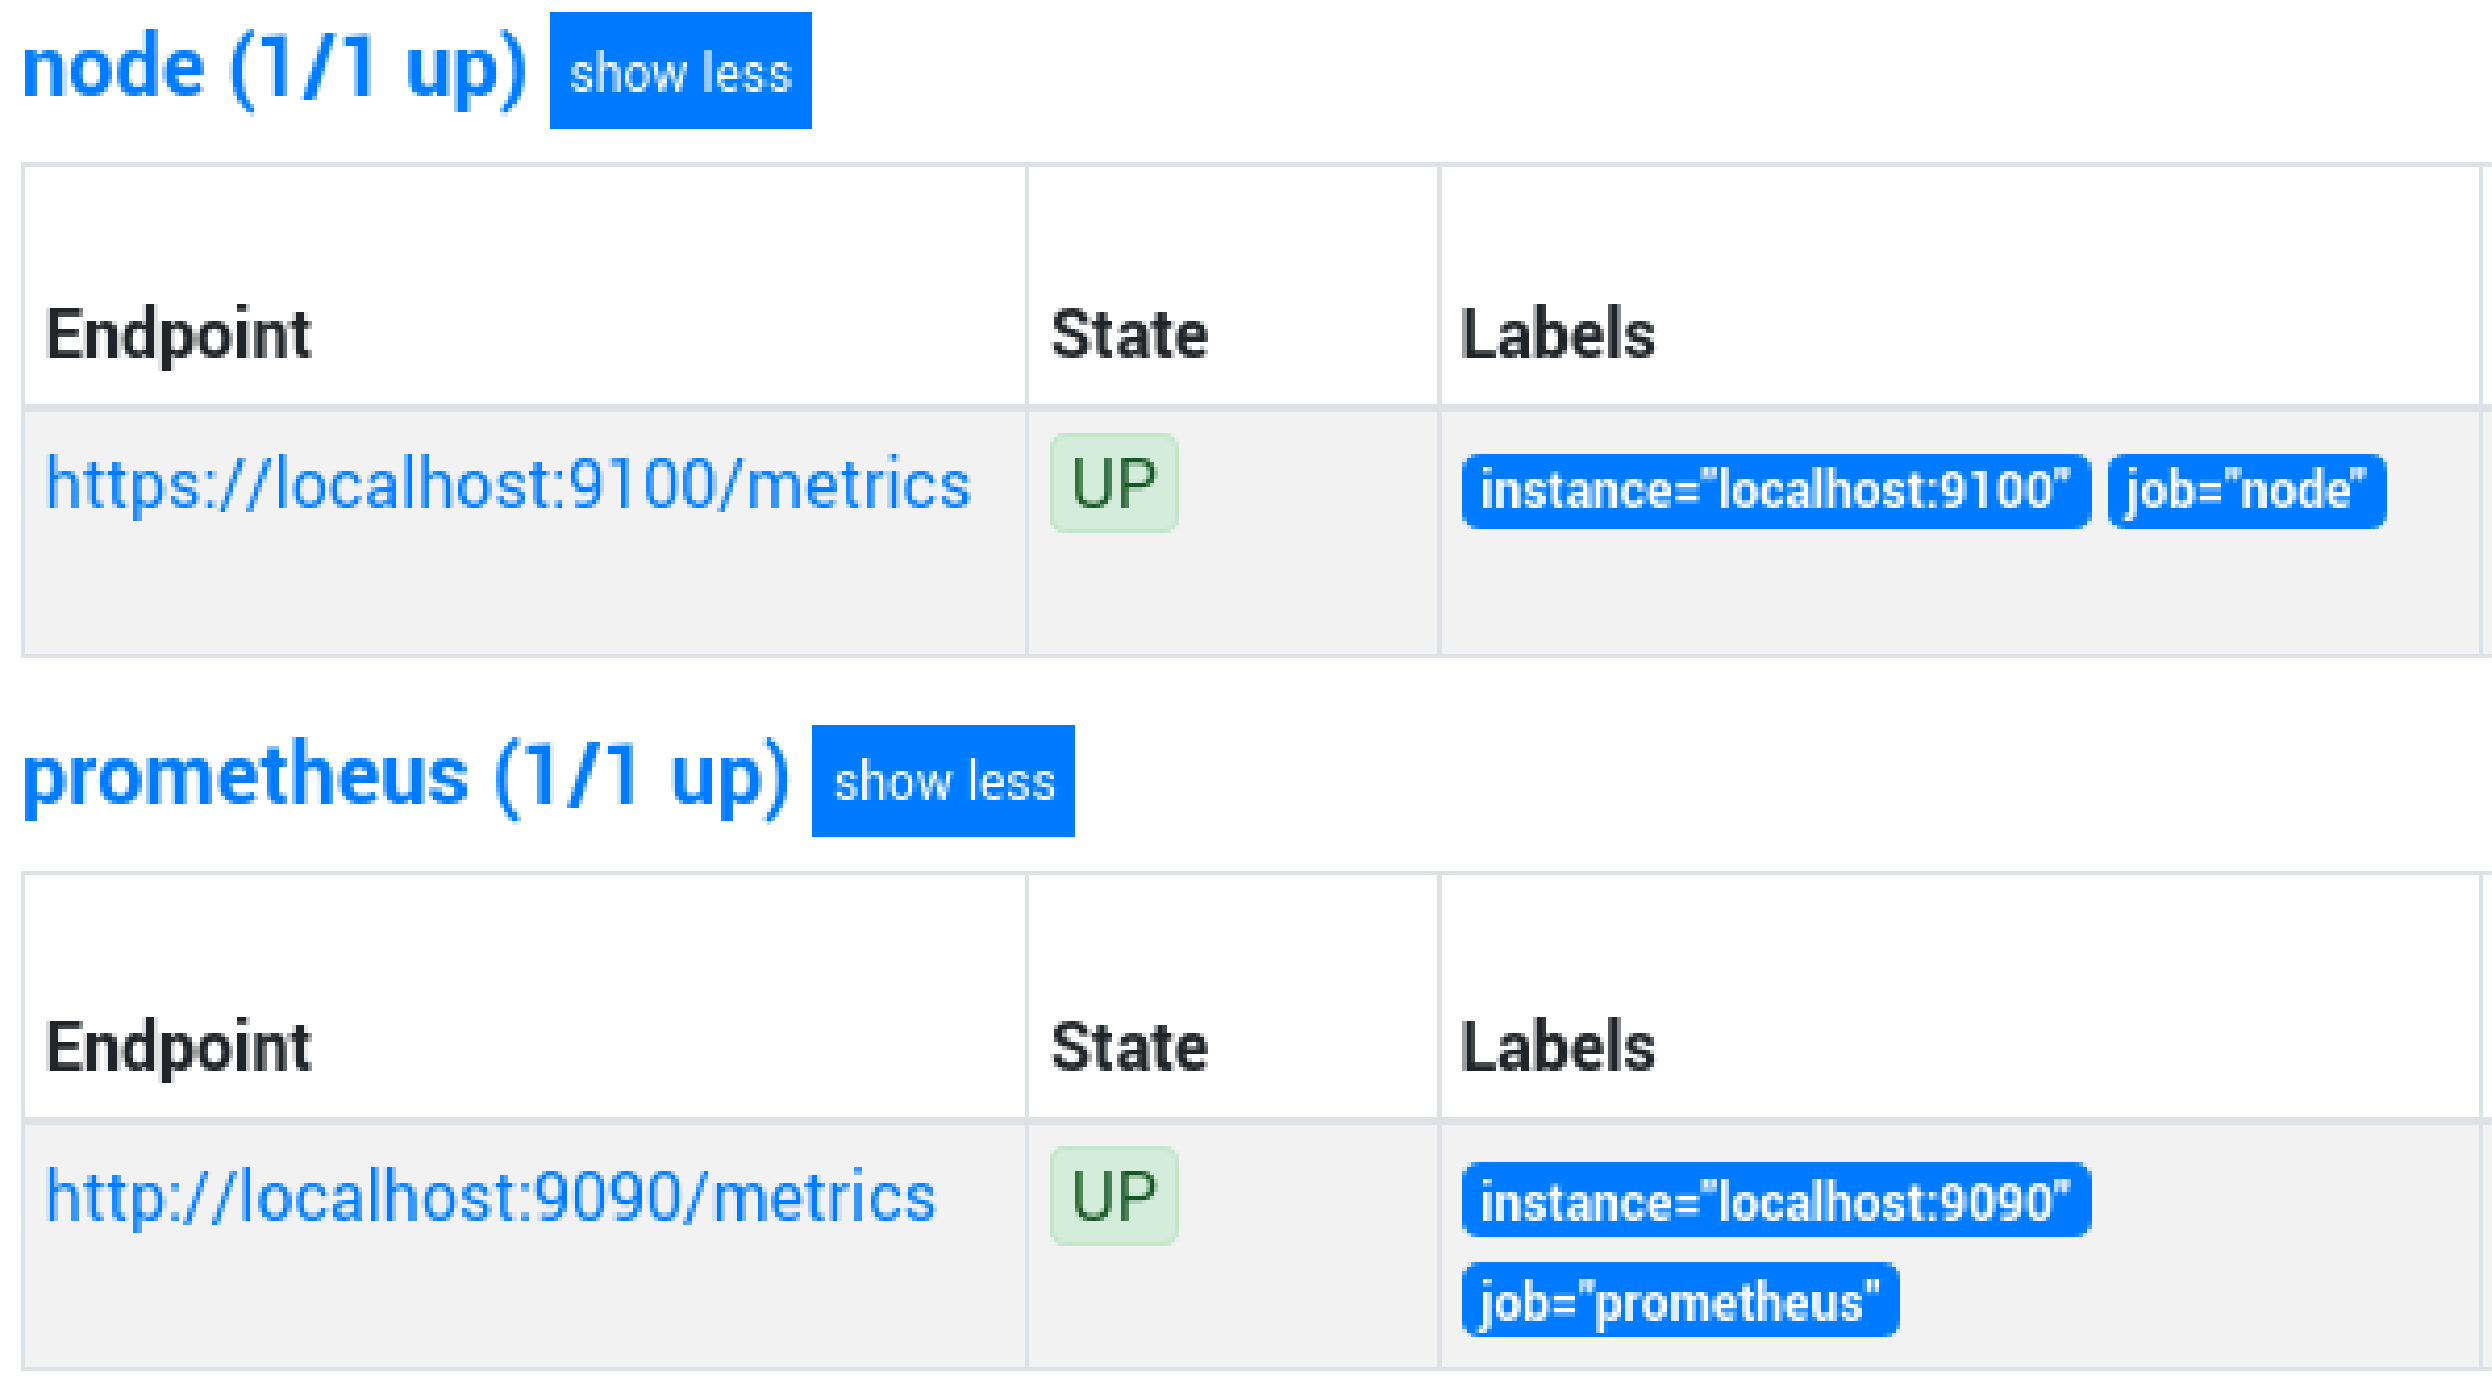
If the target is up, congratulations, you have successfully set-up the Node Exporter with TLS, and metrics are scraped encrypted!
How to - Basic Auth
Let’s go one step further and ask for a username/password. TLS is not mandatory but highly recommended. We will re-use the setup of the previous steps.
Node Exporter configuration
Prometheus uses bcrypt for its passwords, a salted and adaptive password hashing
algorithm. However, using untrusted websites to generate bcrypt passwords is
risky. The O11y Toolkit’s password generator application generates a web.yml
file for basic authentication in Prometheus, allowing you to add and remove
multiple users and adjust bcrypt cost, all of this happening locally in your
browser. For more information, check out our post on passwords for
Prometheus.
In this tutorial, we will use the password is inuitsdemo.
$ cd ~/node_exporter_tls_example/node_exporter-1.0.0.linux-amd64
Add a user in the Node Exporter configuration file web.yml, that we generated
from the password generator:
tls_server_config:
  cert_file: node_exporter.crt
  key_file: node_exporter.key
basic_auth_users:
  prometheus: $2y$10$EYxs8IOG46m9CtpB/XlPxO1ei7E4BjAen0SUv6di7mD4keR/8JO6m
Note: In this file, prometheus is the username.
If the Node Exporter and Prometheus were still running, you should see in the
targets page that the exporter now returns a 401 Unauthorized
error.

Prometheus configuration
Let’s jump back in the Prometheus directory and change prometheus.yml.
$ cd ~/node_exporter_tls_example/prometheus-2.18.1.linux-amd64
global:
  scrape_interval:     15s
  evaluation_interval: 15s
scrape_configs:
  - job_name: 'prometheus'
    static_configs:
    - targets: ['localhost:9090']
  - job_name: 'node'
    scheme: https
    basic_auth:
      username: prometheus
      password: inuitsdemo
    tls_config:
      ca_file: node_exporter.crt
    static_configs:
    - targets: ['localhost:9100']
Reload the Prometheus configuration with a SIGHUP signal:
$ killall -HUP prometheus
If all works, the Node Exporter should be up again in our targets page.
Conclusion
This is a getting started introduction. In production, you should use a proper CA, and pay attention to more details. It is also possible to use client-based certificates for authentication.
The intent is to roll over this kind of HTTPS support across all the official Prometheus exporters in the coming months and the other projects, such as Prometheus, Alertmanager, Pushgateway.
You can find the files presented here in our github repository.
Let’s make monitoring more secure!
Useful links
- Node Exporter 1.0.0 release
- Prometheus Security Model
- TLS server configuration documentation (for Node Exporter)
- TLS client configuration documentation (for Prometheus server)
Are you having trouble with setting up and scaling Prometheus? Our team of observability experts can support the operations of your Prometheus environments.