
Prometheus has some safeguards around queries. In particular, there are two limits you can hit: the query timeout and the max samples limit.
Today, we will explore query timeouts. What you should look for after you hit that issue, how to know when it can happen, and how to find the slow queries.
The symptoms
The error message when hitting the timeout is as follows:
$ curl http://127.0.0.1/api/1/query?query=up
{"status":"error","errorType":"timeout","error":"query timed out in expression
evaluation"}
It however only means that the current query could not finish in time. This can be because the query is effectively too long to execute, or it can be that the PromQL engine is overloaded.
Prometheus has a default timeout of two minutes for the queries but will additionally only execute up to 20 expressions at the same time. Expressions started by the consoles, the web API, or the recording rules all count towards that limit.
These settings are controlled by command line flags, so they can not be changed online. The default limits should be good for almost all of the scenarios.
Metrics
There are a few interesting metrics to find out if your Prometheus is overloaded.
First of all, you can have a look at:
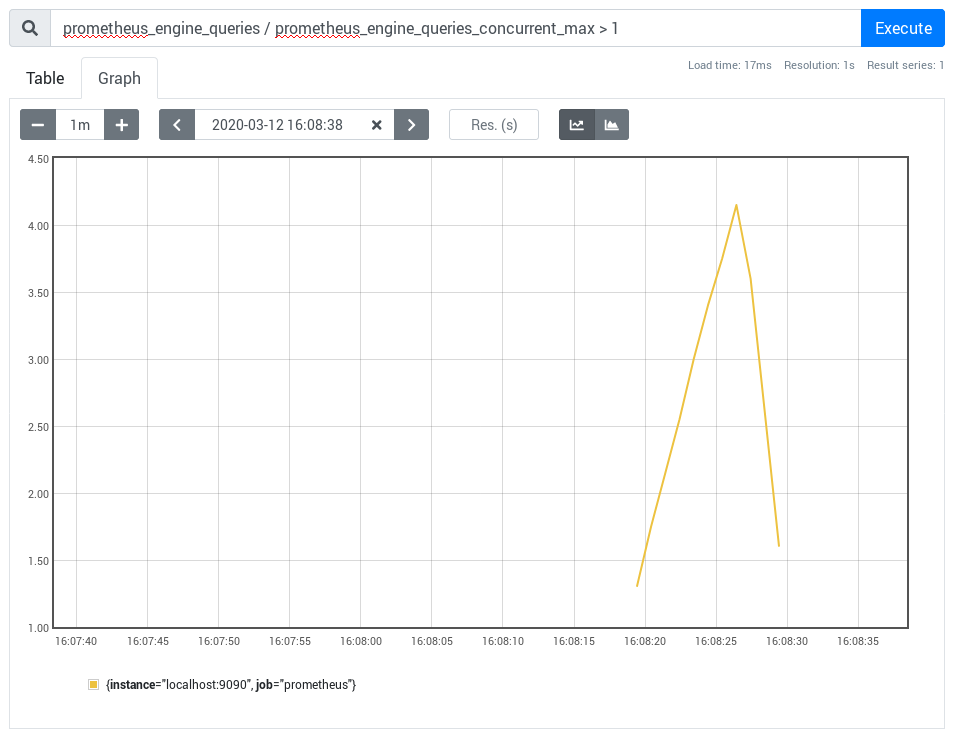
prometheus_engine_queriesprometheus_engine_queries_concurrent_max
If prometheus_engine_queries is greater than prometheus_engine_queries_concurrent_max, it means that some queries are
queued. The queue time is part of the two-minute default timeout.
prometheus_rule_group_last_duration_secondswill tell you the last duration of each one of your groups in seconds.prometheus_rule_group_iterations_missed_totalgrows when a group takes longer than its evaluation interval to run. If that metric increases, then you will want to lower your group evaluation interval or revisit your PromQL expressions.
The query logs
Prometheus has two distinct query logs. One of them, the active query log, is mandatory and can not be disabled. The active query log’s primary goal is to print the requests at the startup of Prometheus. These requests were in flight when Prometheus did exit. This is useful to see which requests where executed e.g. upon an Out-Of-Memory error:
component=activeQueryTracker msg="These queries didn't finish in prometheus' last run:"
queries="[{\"query\":\"{job=~\\\".+\\\"}\",\"timestamp_sec\":1583790390}]"
The active query log is a file called queries.active in the data directory. Which means that you can
also access it when Prometheus is operating to see which queries are in flight:
$ cat data/queries.active
[{"query":"{job=~\".+\"}","timestamp_sec":1583790553},
The second query log will log every query that is run by the engine into a file. This query log is disabled by default and must be enabled by using the query_log_file global option.
global:
  scrape_interval:     15s
  evaluation_interval: 15s
  query_log_file: /prometheus/query.log
scrape_configs:
- job_name: 'prometheus'
  static_configs:
  - targets: ['localhost:9090']
There is an extensive user guide on the Prometheus website about query logs explaining it in more detail. The important part is that each query log line will report a set of counters to help you understand the timings of the queries:
execTotalTime will be the overall time the query took, including
execQueueTime. The actual query evaluation time is evalTotalTime.
The summary metric prometheus_engine_query_duration_seconds also exposes those
counters with different quantiles:
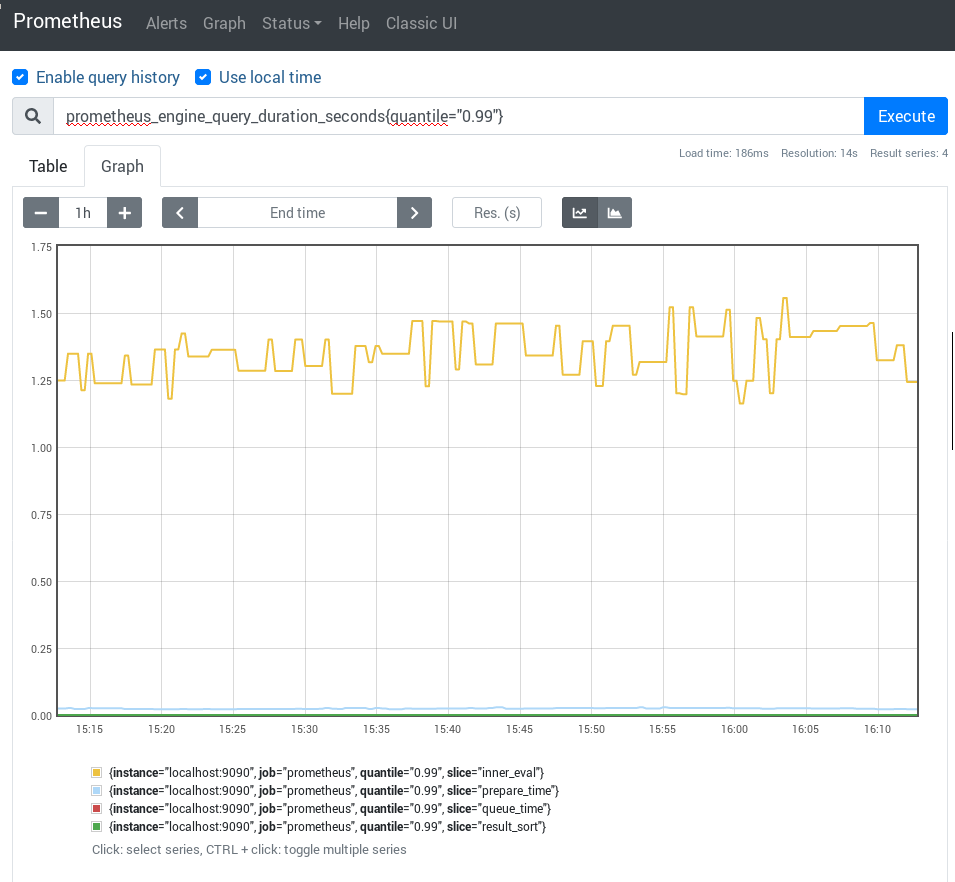
With these three timers, you will likely be able to identify slow queries easily, with a tool like jq:
$ jq 'select(.stats.timings.execTotalTime > 1)' < query.log
{
  "params": {
    "end": "2020-03-09T22:04:44.318Z",
    "query": "avg_over_time(rate(http_requests_total[30d])[10d:])",
    "start": "2020-03-09T22:04:44.318Z",
    "step": 0
  },
  "ruleGroup": {
    "file": "rules.yml",
    "name": "httprate"
  },
  "stats": {
    "timings": {
      "evalTotalTime": 1.000208417,
      "resultSortTime": 0,
      "queryPreparationTime": 1.1604e-05,
      "innerEvalTime": 7.257e-06,
      "execQueueTime": 7.66e-06,
      "execTotalTime": 1.000223386
    }
  },
  "ts": "2020-03-09T22:04:45.365Z"
}
Conclusion
Query timeouts in PromQL have multiple possible causes, but the recent additions of query logs will help you find the slow queries. Those two query logs are supplementary and serve both of them their purpose.
Are you having trouble with setting up and scaling Prometheus? Our team of observability experts can support the operations of your Prometheus environments.