
Prometheus supports TLS and basic authentication over its HTTP endpoints.
Scraping target using HTTPS instead of HTTP has been supported for a long time. You could fetch metrics using HTTPS, client-certificate authentication, and basi contentc authentication.
Last year, the Node Exporter became the first ‘official’ exporter to natively be able to expose metrics over HTTPS. Read our previous blog post to get all the details.
This week, we celebrate the 2.24.0 release of Prometheus. TLS is just the latest in a series of exciting changes that happened recently in Prometheus - like backfilling (also in 2.24) or even switching to a modern React UI.
This blog post focuses on two features: the introduction of TLS and Basic Authentication.
The Prometheus Security Model is the place to look at when it comes to Prometheus and security. If you want to report security vulnerabilities or question our implementation, you can find more information about how those topics are managed within the project here.
If you find a critical security vulnerability in Prometheus, an official exporter or library, please follow the procedure and not communicate about it in public, in such a way that we can find the best way to deploy a fix.
Admin and lifecycle API’s
By default, Prometheus will expose API endpoints to query the data. But there are more API endpoints available:
- Lifecycle endpoints: reload the configuration, quit Prometheus
- Admin endpoints: Delete metrics, take snapshots
They are not enabled by default. If you enable them, you probably want to secure the Prometheus port with some kind of security / authentication.
Securing Prometheus access
Previously, it was common to put a reverse proxy between your clients and your Prometheus server:
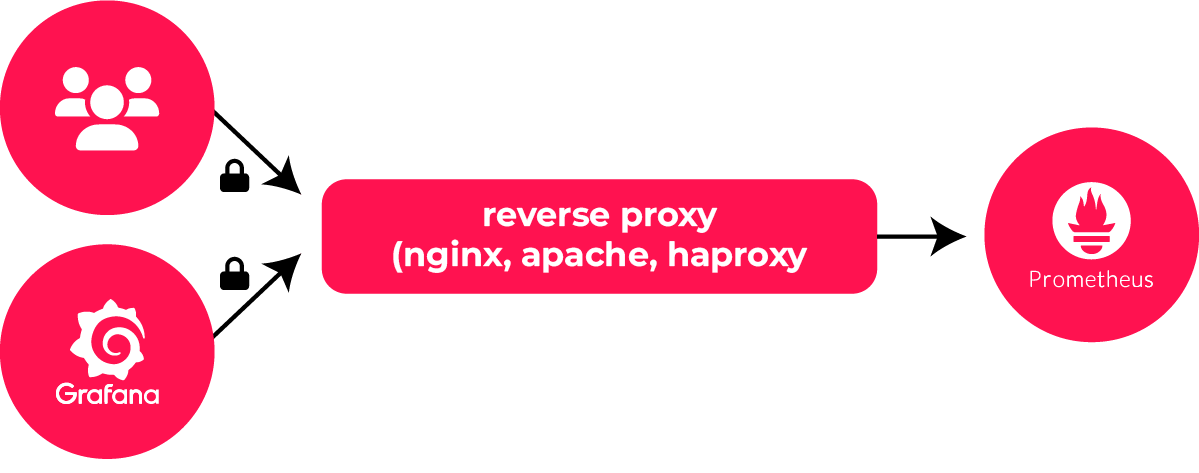
That pattern provides you with more than just access control and encryption. You also get all the extra features of your reverse proxy - they can be: automatic certificate generation, throttling, extra controls, mangling, etc. Realistically, Prometheus is not in the load balancer / reverse proxy business. Therefore, users who need those advanced features would better continue to rely on reverse proxies.
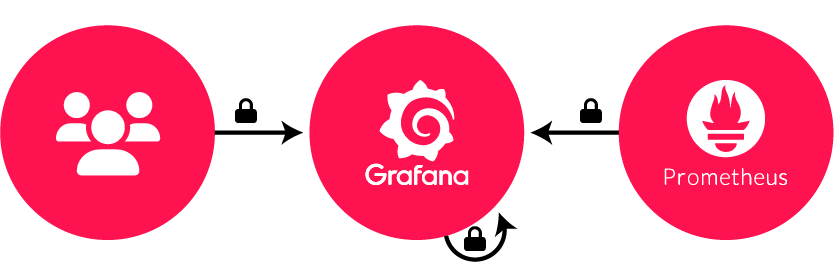
For simple use cases or to secure the traffic between the reverse proxy and Prometheus, there now is a way to secure all the incoming HTTP traffic, built-in.
How to - TLS
Let’s see how that works in practice. This how-to will demonstrate the setup on a Linux box of a Prometheus setup.
Setup a working directory
In this setup, we will work on a dedicated directory:
$ mkdir ~/prometheus_tls_example
$ cd ~/prometheus_tls_example
Generating TLS certificates
The first step is to generate a self-signed TLS certificate that will be used later on.
$ cd ~/prometheus_tls_example
$ openssl req -new -newkey rsa:2048 -days 365 -nodes -x509 -keyout prometheus.key -out prometheus.crt -subj "/C=BE/ST=Antwerp/L=Brasschaat/O=Inuits/CN=localhost" -addext "subjectAltName = DNS:localhost"
In this command line, localhost is the hostname of the Prometheus server.
Two files are created: prometheus.crt and prometheus.key.
Prometheus web configuration
Download Prometheus v2.24.0, extract it, and move the previously created certificates:
$ cd ~/prometheus_tls_example
$ wget https://github.com/prometheus/prometheus/releases/download/v2.24.0/prometheus-2.24.0.linux-amd64.tar.gz
$ tar xvf prometheus-2.24.0.linux-amd64.tar.gz
$ cp prometheus.crt prometheus.key prometheus-2.24.0.linux-amd64
$ cd prometheus-2.24.0.linux-amd64
At this point, we need to create a new configuration file. The server TLS and
authentication are not configured in the main prometheus.yml file. It enables
us to read the file upon every request to directly pick up new users and
certificates.
Let’s create a web.yml file with the TLS configuration:
tls_server_config:
  cert_file: prometheus.crt
  key_file: prometheus.key
Start the Prometheus server, using the --web.config.file command line option:
$ ./prometheus --web.config.file=web.yml
[...]
enabled and it cannot be disabled on the fly." http2=true
level=info ts=2021-01-05T13:27:53.677Z caller=tls_config.go:223 component=web
msg="TLS is enabled." http2=true
If you see that message, it means that the Prometheus server is started with TLS support.
Note: All the TLS parameter can be changed on the fly, however it is not possible to disable TLS once it has been enabled without restarting Prometheus.
You can find the complete documentation about that extra configuration file on the Prometheus documentation.
Manual check of the TLS configuration
Check with curl that the TLS configuration is fine. In a new
terminal, run some commands to test it:
$ cd ~/prometheus_tls_example
$ curl localhost:9090/metrics
Client sent an HTTP request to an HTTPS server.
$ curl --cacert prometheus.crt https://localhost:9090/metrics
[...]
Instead of --cacert prometheus.crt you can pass -k to skip curl
certificate validation.
Scrape configuration
Configuring TLS is an all-or-nothing operation. Once enabled, all the endpoints are protected. This means that Prometheus will use TLS to fetch its own metrics.
Therefore, you need to instruct Prometheus to scrape itself using HTTPS.
Adapt the prometheus.yml ‘prometheus’ job:
global:
  scrape_interval:     15s
  evaluation_interval: 15s
scrape_configs:
  - job_name: 'prometheus'
    scheme: https
    tls_config:
      ca_file: prometheus.crt
    static_configs:
    - targets: ['localhost:9090']
You need to set both the tls_config part of the configuration and
the scheme to https. You can see the full tls_config client options in the
Prometheus configuration.
And then, reload the Prometheus configuration:
$ killall -HUP prometheus
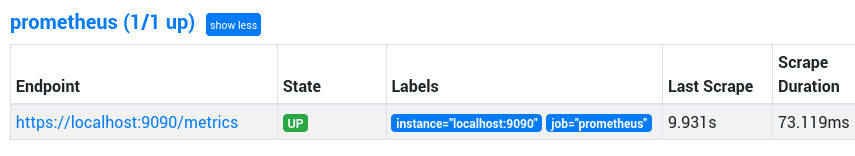
If visit locally https://localhost:9090/targets with your
browser, you should see https://localhost:9090/metrics in the list of
targets.
The target is up? Congratulations, you have successfully set-up the Prometheus server with TLS and metrics are scraped encrypted!
How to - Basic Auth
Let’s go one step further and ask for a username/password. TLS is not mandatory but highly recommended. We will re-use the setup of the previous steps.
Web configuration
Prometheus uses bcrypt for its passwords, a salted and adaptive password hashing
algorithm. However, using untrusted websites to generate bcrypt passwords is
risky. The O11y Toolkit’s password generator application generates a web.yml
file for basic authentication in Prometheus, allowing you to add and remove
multiple users and adjust bcrypt cost, all of this happening locally in your
browser. For more information, check out our post on passwords for
Prometheus.
In this tutorial, the password is inuitsdemo.
Add a user in the Prometheus configuration file web.yml, that we generated
from the password generator:
tls_server_config:
  cert_file: prometheus.crt
  key_file: prometheus.key
basic_auth_users:
  prometheus: $2y$10$EYxs8IOG46m9CtpB/XlPxO1ei7E4BjAen0SUv6di7mD4keR/8JO6m
Note: In this file, prometheus is the username.
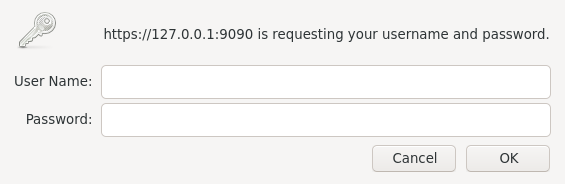
If Prometheus is still running, you now have to enter a password to access the
web interface at https://127.0.0.1:9090 and in the targets page,
that the Prometheus target now returns a 401 Unauthorized error.
Prometheus configuration
Let’s change the prometheus.yml to scrape with the username / password pair.
global:
  scrape_interval:     15s
  evaluation_interval: 15s
scrape_configs:
  - job_name: 'prometheus'
    scheme: https
    basic_auth:
      username: prometheus
      password: inuitsdemo
    tls_config:
      ca_file: prometheus.crt
    static_configs:
    - targets: ['localhost:9090']
Reload the Prometheus configuration with a SIGHUP signal:
$ killall -HUP prometheus
If all works, Prometheus should be up again in our targets page.
Promtool
Prometheus is shipped with a command line tool, promtool. It gained support to validate web configuration files:
$ ./promtool check web-config web.yml
web.yml SUCCESS
Use that with your favourite automation tool to ensure smooth updates of the
web.yml files.
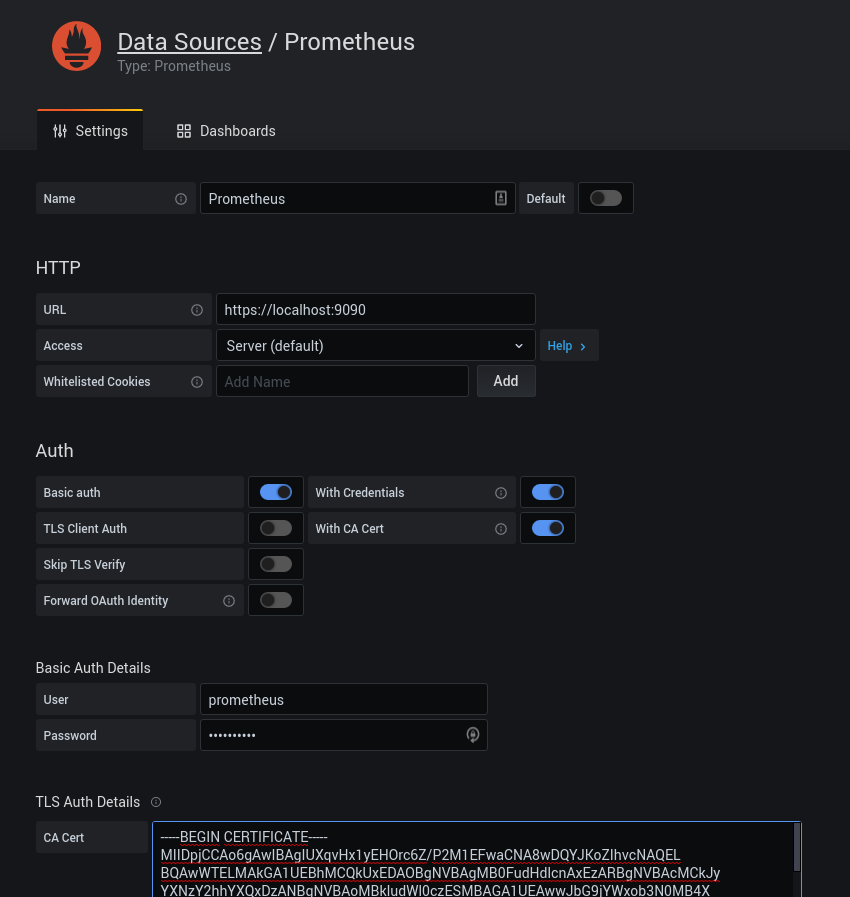
Grafana
Grafana itself supports all the required features to connect to your Prometheus
server. Note that you can either provide a CA (our prometheus.crt) or skip
certificate validation.
Conclusion
This is a getting started introduction. In production, you should use a proper CA, and pay attention to more details. It is also possible to use client-based certificates for authentication.
It is worth noting that for security concerns, this feature is marked as experimental. We might indeed change ciphers, supported TLS versions, over time. Therefore the exact behavior of those features might change over time.
The intent is to roll over this kind of HTTPS support across all the official Prometheus exporters in the coming months and the other projects, such as Alertmanager, Pushgateway.
Let’s make monitoring more secure!
Useful links
- Prometheus 2.24.0 release
- Prometheus Security Model
- TLS server configuration documentation (for Prometheus)
- TLS client configuration documentation (for Prometheus server)
Are you having trouble with setting up and scaling Prometheus? Our team of observability experts can support the operations of your Prometheus environments.