
Prometheus 2.45 LTS
We are excited to announce the release of Prometheus 2.45, the second Long-Term-Support (LTS) release. The first LTS release was Prometheus 2.37.
In this blog post, we will review what we mean by Long-Term-Support release, and explain what you will gain from upgrading from 2.37 LTS to 2.45 LTS.
What is a Long Term Support release?
Regular releases are rolled out every 6 weeks under the supervision of a maintainer, who is responsible for the release process. Should any bug be found after the release, we have the ability to issue bugfix releases. In practice, such releases only happen on the latest minor release.
While upgrading Prometheus within the same major release (v2) should be straightforward due to the stability guarantees, new minor releases bring new features that bring the risk of introducing new bugs, regressions, or impact the performance of the server. Many organizations are not able to keep up with a six-week cadence, as their internal teams are not able to test the releases before deploying them to production.
This situation leads to Prometheus services which experience bugs and security issues, and can threaten the stability of the infrastructure Prometheus running on, or/and the data integrity.
In order to help those slow-paced organizations, we have introduced in 2022 “Long-Term-Support releases”. LTS releases starts like regular releases, but they have an explicit maintenance window of 12 months. LTS releases, instead of concluding their lifecycle after 6 weeks, continue to evolve and mature, while maintaining the same feature set.
What are the currently supported LTS releases?
Our first LTS release was issued in 2022. It was Prometheus 2.37. Prometheus 2.37.8 is the latest bugfix release. The end-of-life of Prometheus 2.37 is scheduled to be the 31st July 2023.
The second one is Prometheus 2.45, with Prometheus 2.45.0 released this week. It will be supported for a period of 13 months until the 31st July 2024.
During the one-month overlap where both LTS releases are supported, users are encouraged to test and upgrade to the 2.45 release.
What are the highlights between 2.37 LTS and 2.45 LTS?
Splitting scrape configurations into multiple files
Users who have many scrape configurations can split them into multiple files, by
using the new scrape_config_files configuration key. It should contain a list
of files which contain a list of scrape configurations. The last part of the path
can contain wildcards, in which case Prometheus will use file globbing to read
all the files that match the pattern.
Here is an example of prometheus.yml which takes advantage of the new setting:
global:
  scrape_interval: 15s
  evaluation_interval: 15s

alertmanagers:
  - static_configs:
    - targets:
      - alertmanager:9093

rule_files:
  - "rules/*.yml"

scrape_config_files:
  - "scrapes/*.yml"
Now, if you drop a file in scrapes/prometheus.yml with the following content,
you will have your Prometheus scrape itself:
scrape_configs:
  - job_name: "prometheus"
    static_configs:
      - targets: ["localhost:9090"]
Individual files must have the scrape_configs top-level key. It is also
important to note that Prometheus will only reload scrape configs on reload.
There is no active or regular scan for file changes.
It is possible to combine inline scrape_configs and scrape_config_files inside the same main configuration file.
Scrape files are not merged together, so the job_name of each scrape job must be unique across all files.
Keep_firing_for for alerts
Prometheus alerts have a for field, which indicates the amount of time an expression must return values for an alert to go from pending to firing.
There is now a new field, keep_firing_for. This field determines the amount of time an alert in firing state will remain firing after the alert expression stops returning values.
It means that if you have an unstable condition, you can use keep_firing_for to stabilize the alert and not receive the resolved notification too early.
alert: InstanceDown
expr: up{job="my_job"} == 0
for: 5m
keep_firing_for: 30m
This example means that when an instance of my_job is reported as down for 5 minutes, Prometheus will wait 30 minutes after recovery to consider the alert resolved. This can help to reduce the instability of some alerts.
Formatting PromQL queries
When dealing with complex PromQL queries, it might be useful and helpful to be able to pretty print them.
In the Prometheus 2.45 web UI, you can click on the formatting button next to the expression input to format and indent your PromQL queries. This will enable you to visualize and edit your queries more easily. This feature is also available as an API endpoint if you need to integrate it with other tools and services.
Service discoveries
OVHCloud has been added as a new native service discovery provider.
The DNS SD now supports MX records, enabling you to monitor mail servers. As an example, here is how you can use it to monitor that you have SMTP open on the servers that are in your MX records:
scrape_configs:
  - job_name: smtp
    dns_sd_configs:
      - names: [prometheus.io]
        type: MX
        port: 25
    metrics_path: /probe
    params:
      module: [smtp_smarttls]
    relabel_configs:
      - source_labels: [__address__]
        target_label: __param_target
      - source_labels: [__param_target]
        target_label: instance
      - target_label: __address__
        replacement: 127.0.0.1:9115
Kubernetes SD has got new meta labels, such as __meta_kubernetes_service_port_number and __meta_kubernetes_pod_container_image. The API calls to kubernetes are now done with protocol buffers instead of JSON.
AWS SDs have new __meta_ec2_region and __meta_lightsail_region labels.
Other quality of life improvements
When using HTTP proxies, you can now set Proxy Authentication headers. We also have support to read proxies from environment variables (must be enabled explicitly with proxy_from_environment: true) and support for no_proxy.
Per-scrape limits, such as limits over the number of labels, the number of samples, the length of label names and values, can now be set in the global section of the configuration file.
Users using remote write to Azure Monitor workspace do not need a sidecar to authenticate anymore thanks to the new azuread configuration option.
Experimental features
Experimental features are only supported as a best effort option in the Long Term Support releases. However, users are encouraged to test them and provide feedback.
There are two experimental features I want to highlight in particular; native histograms and out-of-order ingestion.
Native histograms are a new way to emit and scrape histograms.
Histograms are a way to track the distribution of continuous values over time. They provide insight into the spread and shape the data, and are mainly used to calculate percentiles. They are particularly useful for monitoring latencies.
Classic histograms used one metric per bucket, as follows:
# HELP http_request_duration_seconds Histogram of latencies for HTTP requests.
# TYPE http_request_duration_seconds histogram
http_request_duration_seconds_bucket{le="1"} 0
http_request_duration_seconds_bucket{le="2.5"} 1
http_request_duration_seconds_bucket{le="5"} 2
http_request_duration_seconds_bucket{le="+Inf"} 2
http_request_duration_seconds_sum 6
http_request_duration_seconds_count 2
Native histograms are seen and indexed as a whole. They are using sparse, precise buckets that highly increase the correctness of quantile calculations. It means that instead of having different sum, count, and bucket metrics, only relevant labels are indexed and the buckets are attached to that label set.
The following heatmaps show on the left classic histograms, and native histograms on the right. The underlying service used to produce the data is the same.
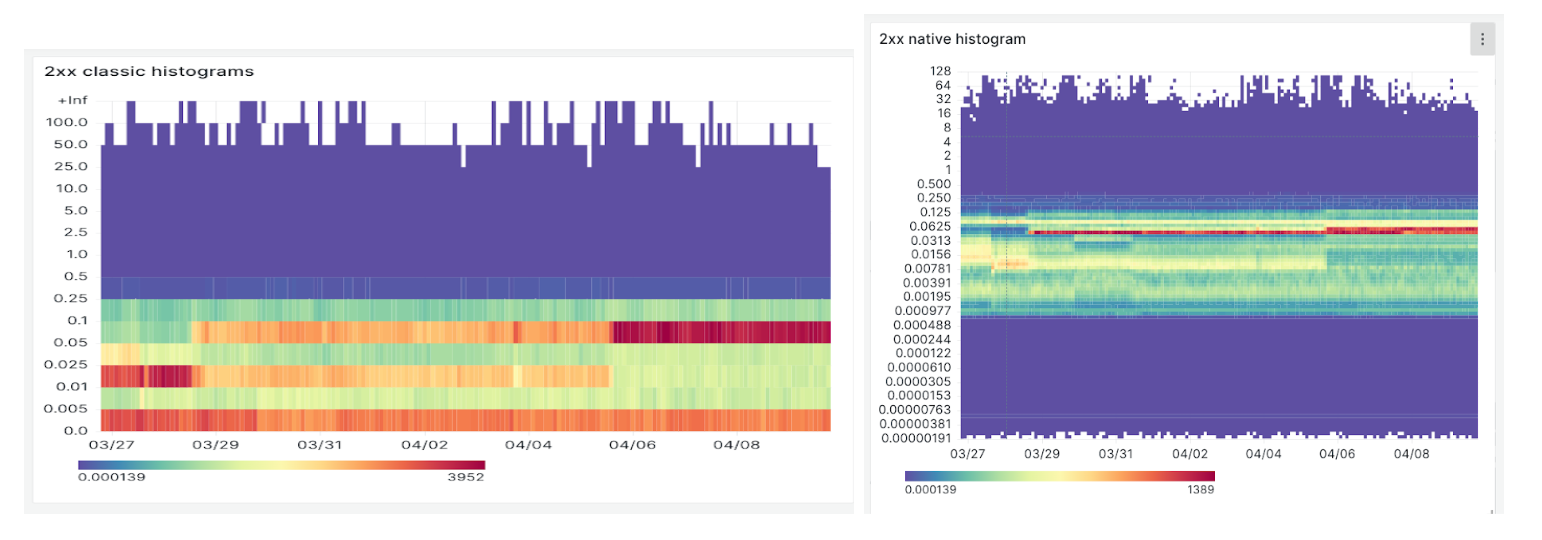
With native histograms, we get a better glance at what is happening in the sub-0.005 bucket. The difference in precision is very useful to better understand how a service is performing.
Enabling native histograms requires minor changes in the instrumentation of the applications. A feature flag must also be enabled on the server side. If you want to learn more about these, you can listen to these promcon 2022 talks: Native histograms in Prometheus, and PromQL for native histograms.
Out-of-order ingestion gives you control about whether Prometheus can ingest
unordered data. A new setting, tsdb: out_of_order_time_window indicates how
far in the past you are willing to ingest data. This setting can be useful when
you are backfilling data from other systems.
Out-of-order ingestion works both with the text format, where you can expose metrics with a timestamp, and with the remote write endpoint that’s built into Prometheus.
Conclusion
To summarize, you will experience new features and improvements between Prometheus 2.37 and 2.45. You should also note performance improvements. As usual, the CHANGELOG contains all the bugfixes, features and enhancements that could impact users.
We encourage users on the LTS release to switch to 2.45. Users who do not wish to upgrade Prometheus every 6 weeks to a new major release are also welcome to use it.
You can find Prometheus 2.45 on the Prometheus download page, and as container
images prom/prometheus:v2.45.0 or quay.io/prometheus/prometheus:v2.45.0.
Happy monitoring!