
Managing dashboards, the easy way
In today’s world, every moving part of an infrastructure is automated to reduce the chances of human error. CI/CD practices aim to reduce these risks and build reproducible artefacts that are deployable whenever we want.
We do not just build pipelines for applications. We also adopt practices such as Continuous Delivery of the Infrastructure as Code, and just like the applications we do this by leveraging Pipeline as Code.
So each infrastructure component that is built or managed is deployed automatically via a pipeline. Except for our dashboards.
This blog post introduces Dashboard Manager. And we will show how to manage and promote dashboards between Grafana instances.
What is a dashboard?
You could argue that dashboards are user-generated content and that a backup is sufficient.
A dashboard is typically an opinionated view of an application or an infrastructure component based on the personal opinion of what the person who created that dashboard cares about within the boundaries of his job/responsibilities.
But other people argue that every application needs to have the same default set of dashboards with basic information.
Where does it go wrong?
Often multiple dashboards for similar applications are created. Or even worse, a manually crafted dashboard from one person is being improved by a colleague with good intentions. It then becomes partially or even totally useless for the original creator.
It’s frequently a fast track to multiple dashboards existing with different information and people not finding the dashboard they need when they need it because it has been slightly or totally modified or moved around.
So the typical workflow ends up being:
- Someone creates a dashboard.
- Someone either clones or directly edit that dashboard.
- Someone then modifies one of those dashboards.
- And so on.
This workflow transforms a clean and structured view of an application landscape into unmaintainable chaos.
At this point, we have reached dashboard sprawl status. People are effectively hacking on their dashboards in production.
All this smells like the typical manual software deployment problem, a perfectly crafted snowflake, which eventually nobody dares to touch or update.
Luckily we have a solution for that problem. It’s called automation.
Dashboard as code: the way to go?
Ideally, you want to build dashboards in a development environment and promote tested changes to a production environment where nobody can modify these changes anymore.
Dashboards as code can give us reproducability and traceability on why someone changed a dashboard and when. Moreover, it also allows you to roll back to a previous dashboard version if needed.
It’s easy to take this problem and assume that the solution here is to create dashboards from code and put the code that generates these dashboards under source control.
By creating, the dashboards from code, we can template patterns and have that basic set of standardised uniform dashboards. Then this becomes just another artefact that you want to promote from one environment to another.
But how do you create dashboards from code ? At some point we used Jsonnet, but then Jsonnet was declared dead and then back alive. We looked at Grafonet, Grafanalib, etc.
For many people, this worked fine, but the reality is that the average person who wants to create and manage dashboards is not a Json/Yaml engineer.
You can have a basic set of dashboards that you generate, but in reality most people want to use the Grafana UI to tweak their dashboards.
Dashboard manager for Grafana
So, to efficiently manage dashboards, we need a hybrid approach. A way where you can generate a certain number of dashboards from code and a low-code/ no-code method for those who handcraft their dashboards in a development environment. Moreover, it should be possible to promote both these types of dashboards from a development to a production environment.
To get this hybrid approach working, we created a Dashboard Manager for Grafana. https://github.com/o11ydev/dashboard-manager
The Dashboard Manager is a tool that assumes you have:
- At least two Grafana instances
- A development (input) and a production (output) instance
- And lets you pick dashboards that can be promoted from development to production in a trivial fashion.
We use it tightly coupled with Gitlab, but it also works with other frameworks. Let’s have a look at the workflow.
The workflow
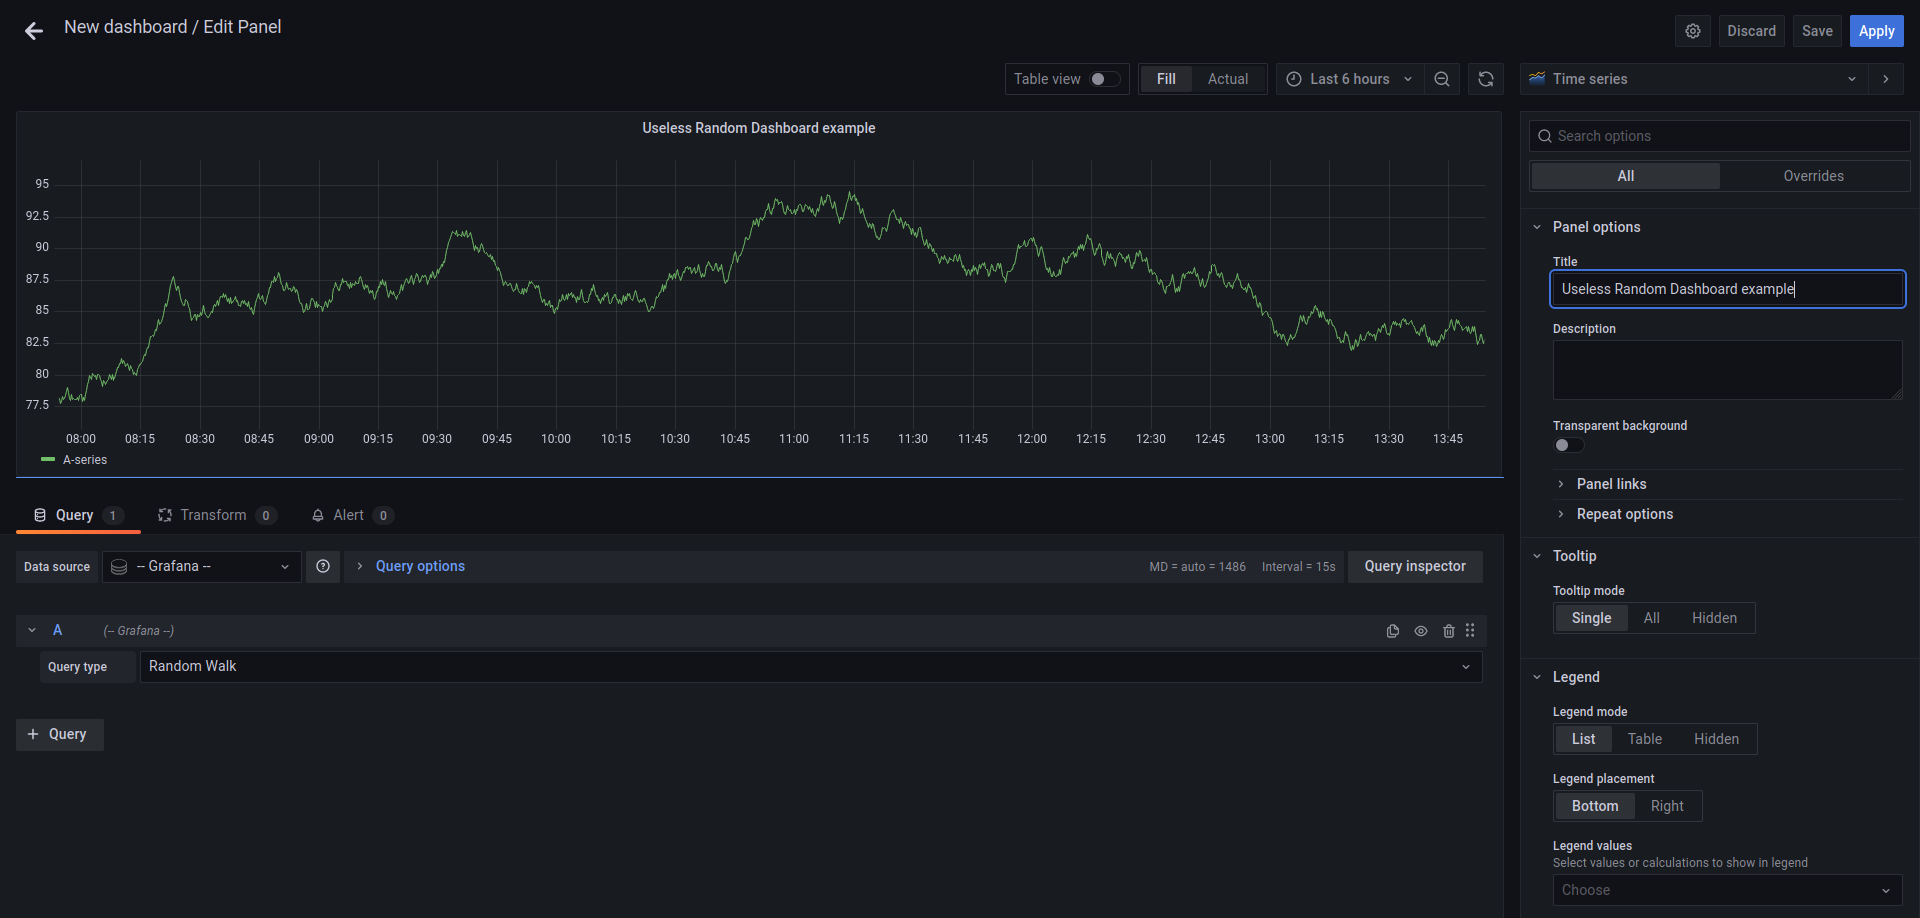
Step 1: Create a new dashboard with a graph.
Step 2: Go to your Gitlab instance and trigger the dashboard-manager pipelines
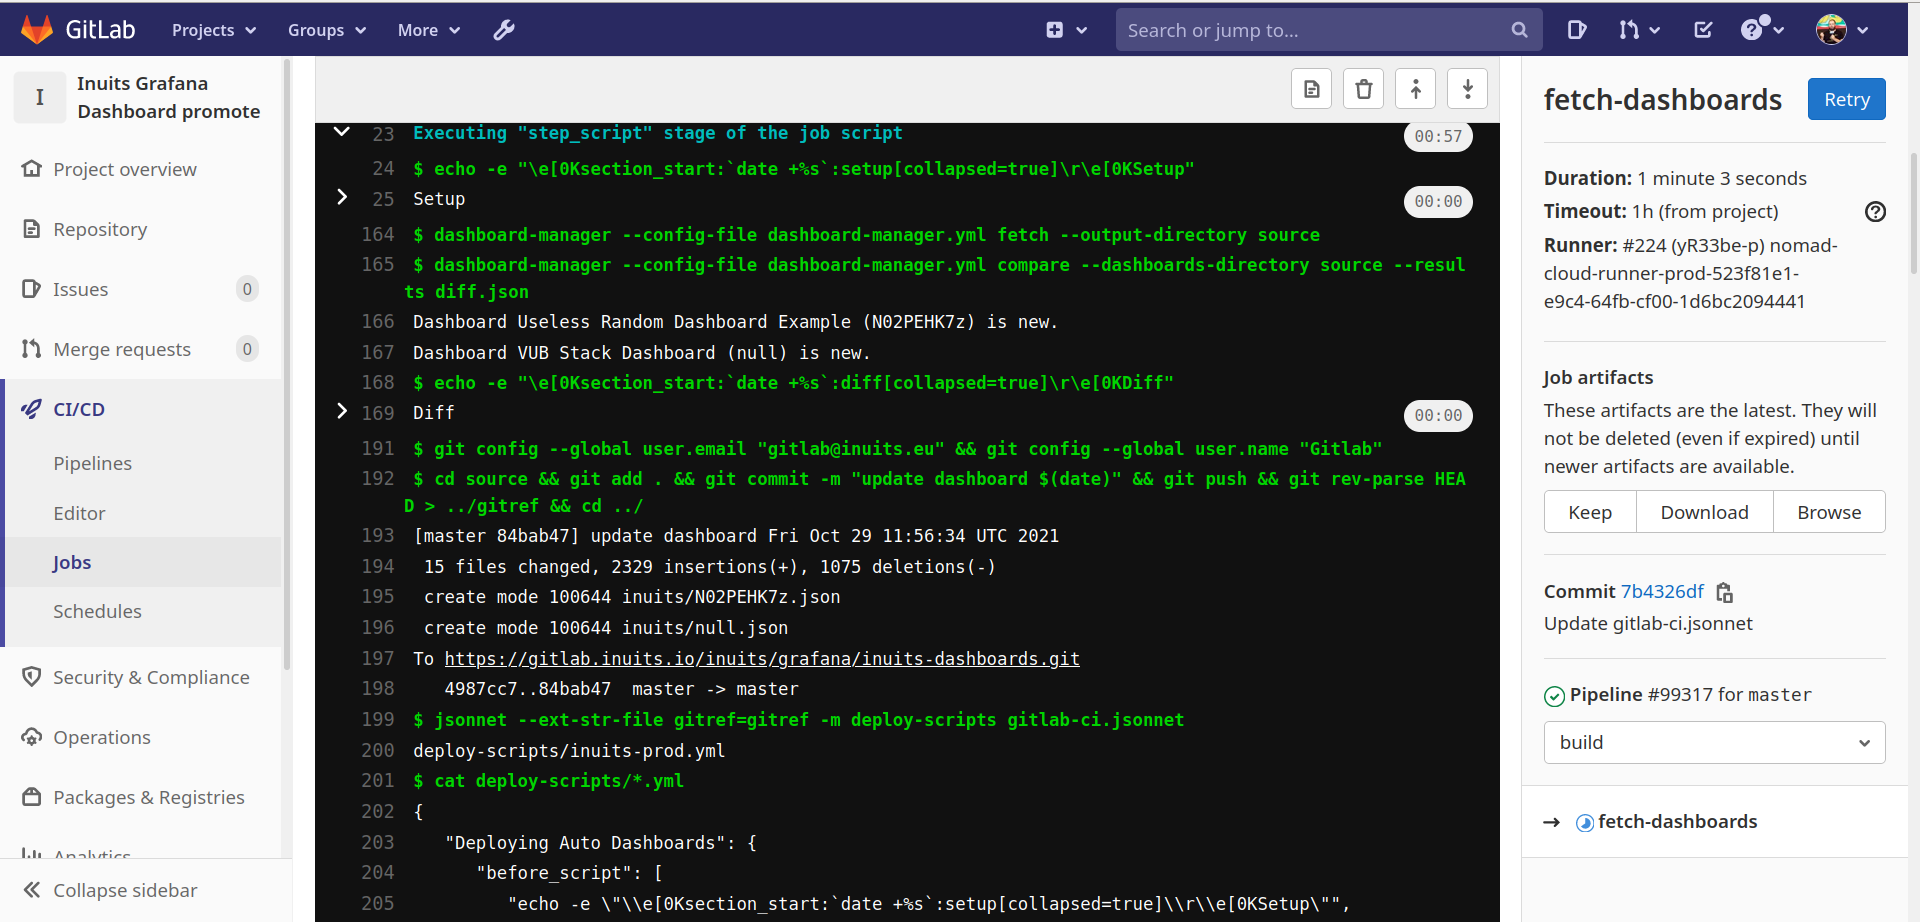
This task does multiple things:
- It fetches the dashboards from the dev Grafana instances.
- It compares the dashboards to what it already has. You can see it detected multiple new dashboards, including the Dashboard example we just created.
- It then proceeds with storing these new dashboards in a git repository.
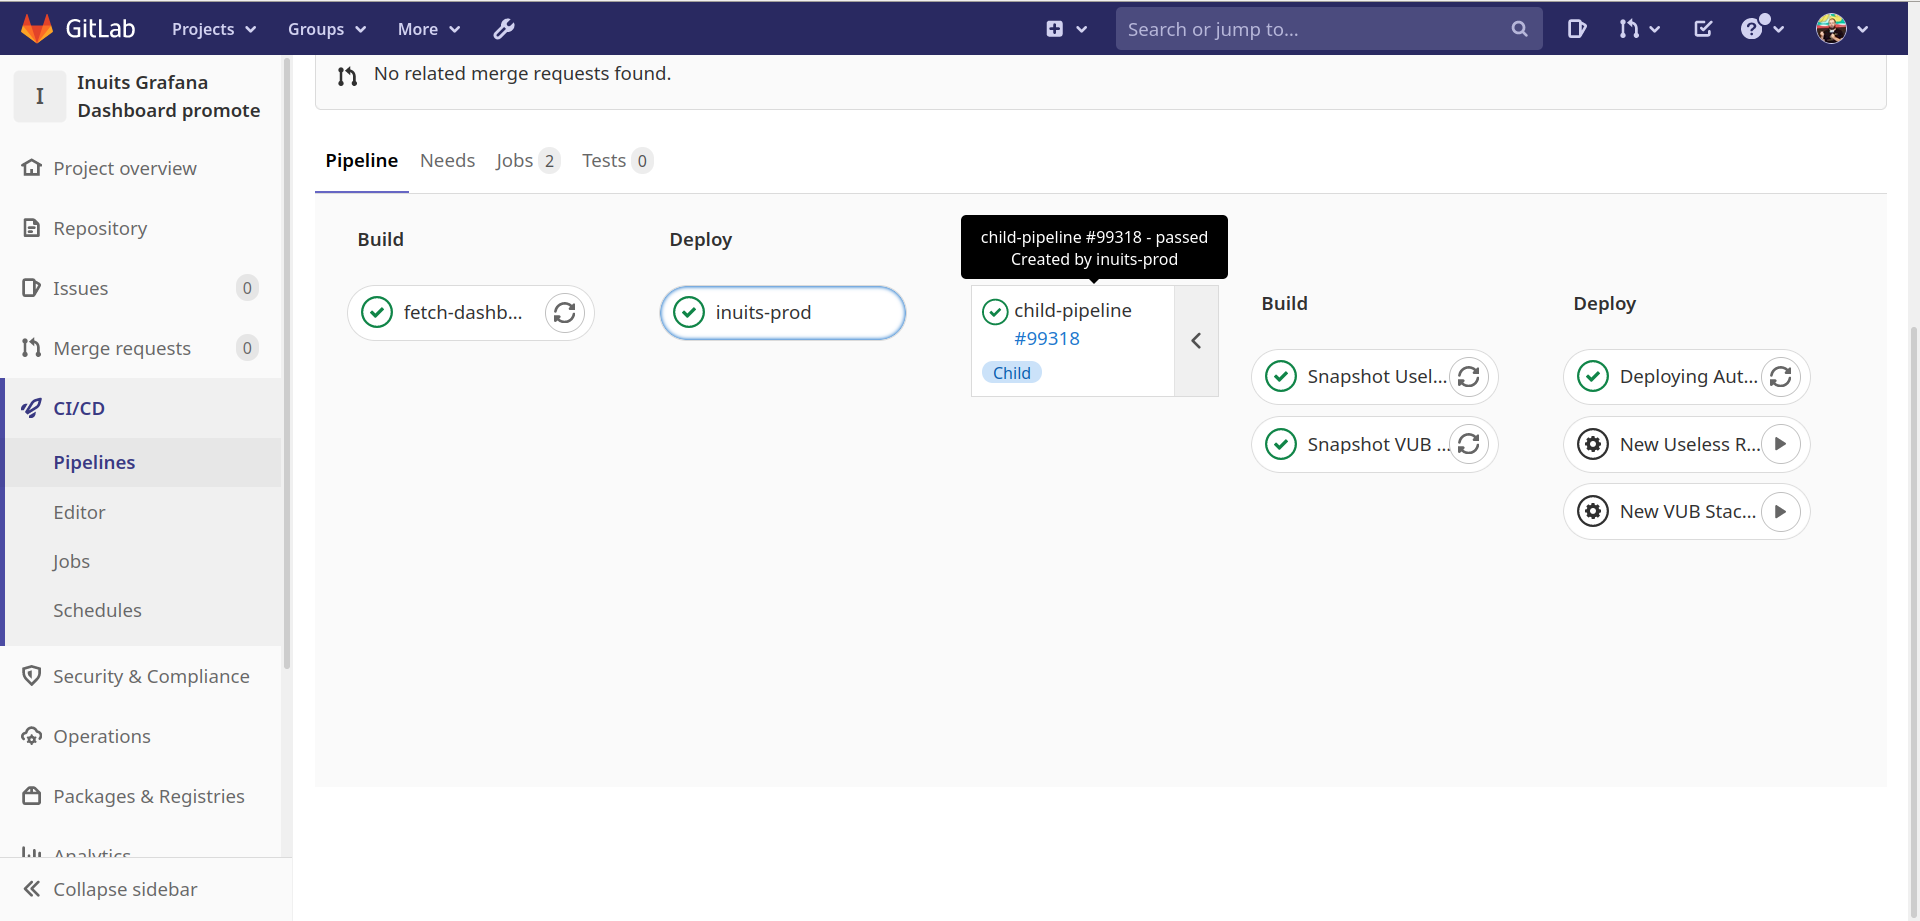
- It will create multiple Child jobs in Gitlab that allow you to cherry-pick which new or updated dashboard you want to deploy to prod.
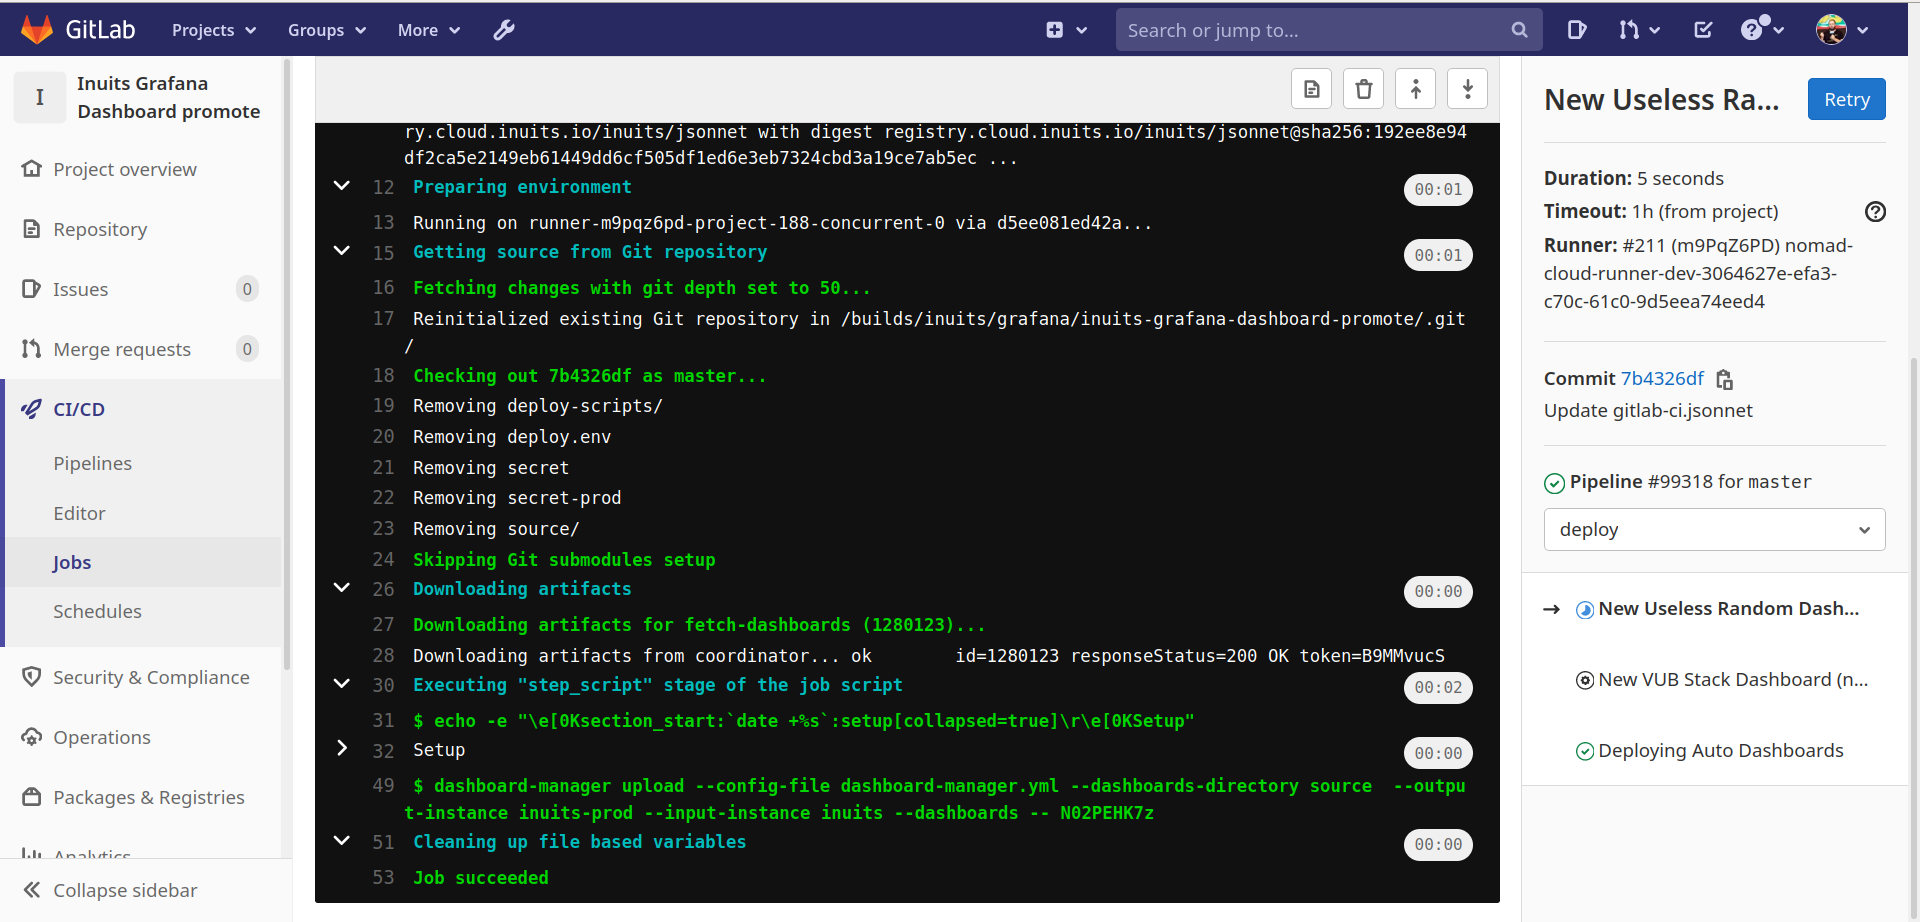
Step 3: Select a deploy job.
It will start uploading the selected dashboard to the production environment
Conclusion
The result is a reproducible Dashboard ecosystem that caters for both people who want to craft their dashboards from Code, and for people that want to leverage the UI’s to create their dashboards manually.
Let us know what you feel that is still missing in this approach.