The O11y toolkit
Today, we are launching the O11y toolkit: a set of utilities to help you maintain, debug, and augment your open source observability stack.
Our tools will improve your experience with metrics, logs, and traces. We have a couple of tools published already. We want a seamless user experience across the tools, providing as much consistency in behaviour and packaging.
The tools are downloadable individually, as standalone binaries, and deb,
rpm, and nix packages.
oy-scrape-jitter
The first tool we’d like to announce is oy-scrape-jitter. This tool queries
Prometheus servers to find the jitter in scrape timestamp alignment.
Prometheus uses delta-of-delta encoding and XOR compression of timestamps. It means that when the time distance between scrapes is exactly aligned, a timestamp can be stored in TSDB using a single bit.
Having equally distanced scrapes is therefore a massive gain in disk space. In theory, Prometheus should do equally-distance scrapes. However, we have noticed in the field that very often, jitter appears. Timestamps are not perfectly aligned, therefore timestamps take more disk space than they should.
Which is why we have developed oy-scrape-jitter. You can run it as follows:
$ ./oy-scrape-jitter --prometheus.url=https://prometheus.demo.do.prometheus.io/ --plot.file=jitter.png
level=info metric="up{env=\"demo\", instance=\"demo.do.prometheus.io:9093\", job=\"alertmanager\"}" aligned=239 unaligned=0 max_ms=0 pc=100.00%
level=info metric="up{env=\"demo\", instance=\"demo.do.prometheus.io:9100\", job=\"node\"}" aligned=233 unaligned=6 max_ms=23 pc=97.49%
level=info metric="up{instance=\"demo.do.prometheus.io:3000\", job=\"grafana\"}" aligned=237 unaligned=2 max_ms=14 pc=99.16%
level=info metric="up{instance=\"demo.do.prometheus.io:8996\", job=\"random\"}" aligned=179 unaligned=60 max_ms=2 pc=74.90%
level=info metric="up{instance=\"demo.do.prometheus.io:8997\", job=\"random\"}" aligned=239 unaligned=0 max_ms=0 pc=100.00%
level=info metric="up{instance=\"demo.do.prometheus.io:8998\", job=\"random\"}" aligned=237 unaligned=2 max_ms=3 pc=99.16%
level=info metric="up{instance=\"demo.do.prometheus.io:8999\", job=\"random\"}" aligned=237 unaligned=2 max_ms=4 pc=99.16%
level=info metric="up{instance=\"demo.do.prometheus.io:9090\", job=\"prometheus\"}" aligned=237 unaligned=2 max_ms=8 pc=99.16%
level=info metric="up{instance=\"http://localhost:9100\", job=\"blackbox\"}" aligned=233 unaligned=6 max_ms=2 pc=97.49%
level=info metric="up{instance=\"localhost:2019\", job=\"caddy\"}" aligned=239 unaligned=0 max_ms=0 pc=100.00%
level=info aligned_targets=3 unaligned_targets=7 max_ms=23
Each line represents a target.
level=info metric="up{instance=\"demo.do.prometheus.io:8996\", job=\"random\"}"
 aligned=179 unaligned=60 max_ms=2 pc=74.90%
This line shows that for the target {instance="demo.do.prometheus.io:8996",
job="random"}, more than 25% of the scrapes are not aligned. On disk, it means
that the delta-of-delta and XOR compression will not be effective, ending up
with a lot more used disk space.
Case study
One of our customers had a constantly growing Prometheus storage. Running our tool showed the following result:
level=info aligned_targets=185 unaligned_targets=5440 max_ms=497
Which means that in a total of 5625 targets, only 185 were aligned in the past hour.
Our histogram showed that 150.000 scrapes were not aligned, but very closely to zero:
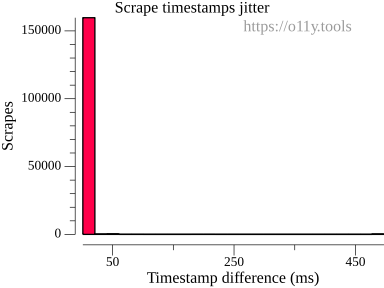
We decided to adjust the scrape tolerance with a higher value of 49ms.
To do so, we added the --scrape.timestamp-tolerance=49ms parameter when
launching Prometheus.
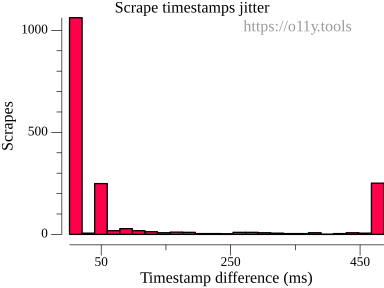
After a few months, we ran the tool again, with the following result:
level=info aligned_targets=5551 unaligned_targets=104 max_ms=487
Out of the 5655 jobs, 5551 are now aligned.
Looking at the histogram generated by oy-scrape-jitter, we see that very few
scrapes are now unaligned:
Conclusion
Overall, what was the effect of adjusting the timestamp on disk space?
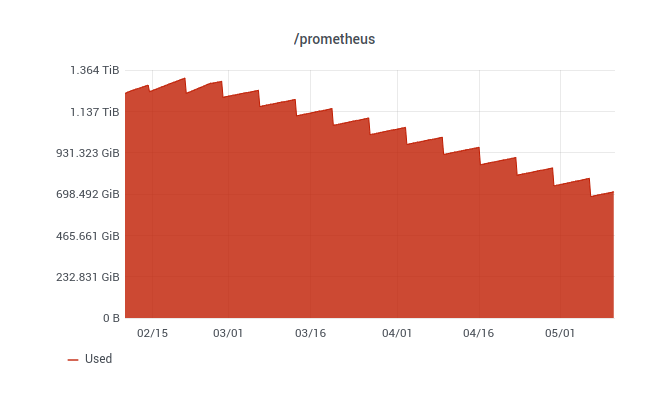
Our customer has seen a 40% disk space reduction by only changing a command-line parameter. Given the fact that not all blocks have been rolled over, the decrease will continue for the rest of the retention period.
While collecting data at several other customers, we have noticed that not every
Prometheus instance needs this setting. Thanks to oy-scrape-jitter, we can diagnose this easily and propose this adjustment where it makes sense.
Because this affect the size of the blocks, it will also help Thanos, Cortex, and Mimir users to reduce the size of their blocks, and therefore reducing the amount of S3 storage needed for those solutions.